
How to easily debug your Android apps running in the debug configuration in either emulator or real device using DDMS or Chrome Device Inspector. Compatible with Apache Cordova or any other type of Android, Ionic, React Native, Angular app as well.
![]()
Debug with DDMS from Android SDK
Android Device Monitor, also known as DDMS (Dalvik Debug Monitor Server) is a tool provided by the olders Android SDK standalone installer. This tool is generally located at: C:\Program Files (x86)\Android\android-sdk\tools\monitor.bat. DDMS can debug Android 4.1.2 (API 16) and newer / older API levels.
- Open monitor.bat with your emulator running or devices connected.
- Click the plus (+) icon in the LogCat tab.
- Enter your app’s identifier to filter log messages.
- You can filter by event type (verbose, debug, error, warning) with the drop down
- To filter Cordova related events, type cordova|chromium|console in the filter input box on the right.
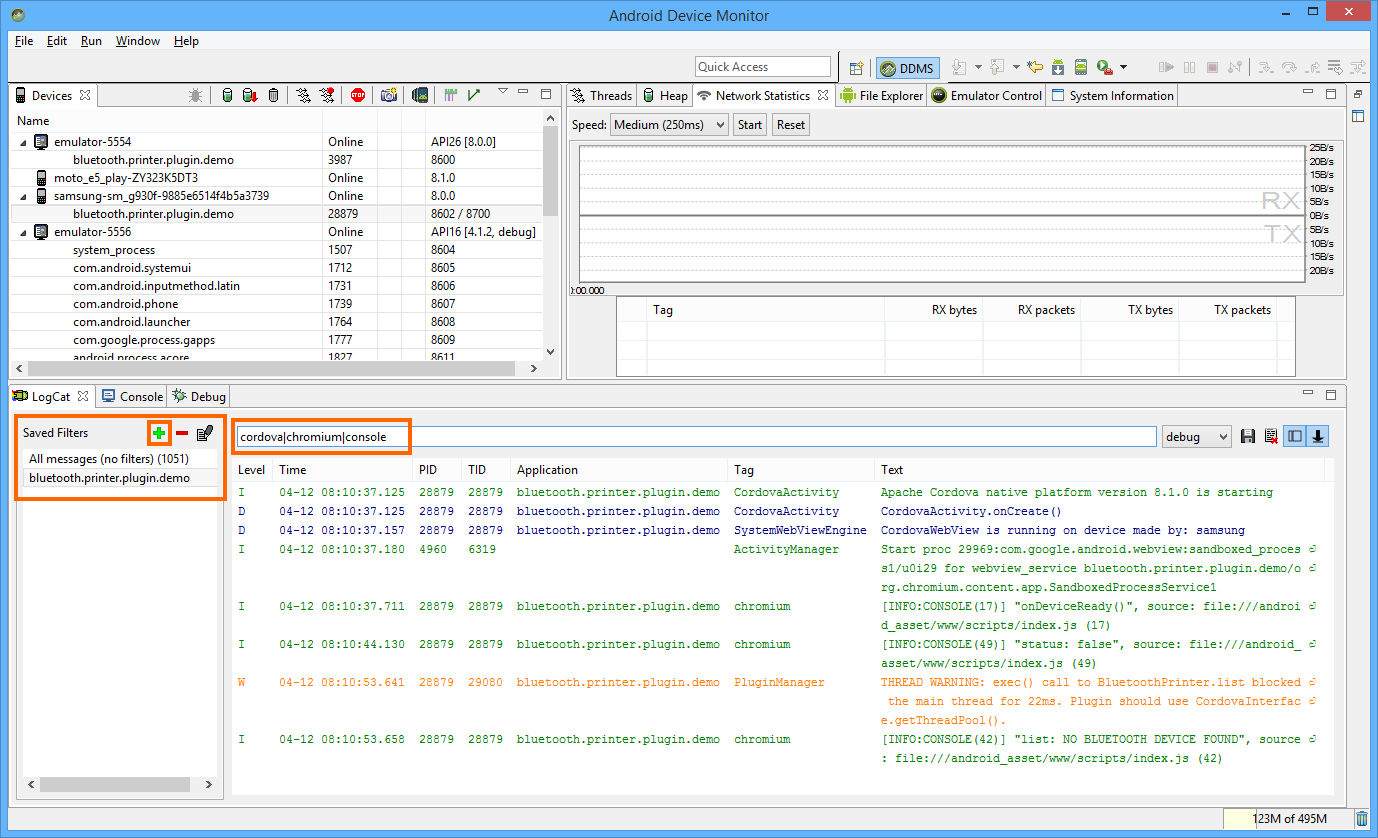
Debug Cordova app with DDMS in all Android targets
Make sure your phone has USB Debugging enabled. If you can’t see your app, select it as Debug app in the device’s Developer Options menu.
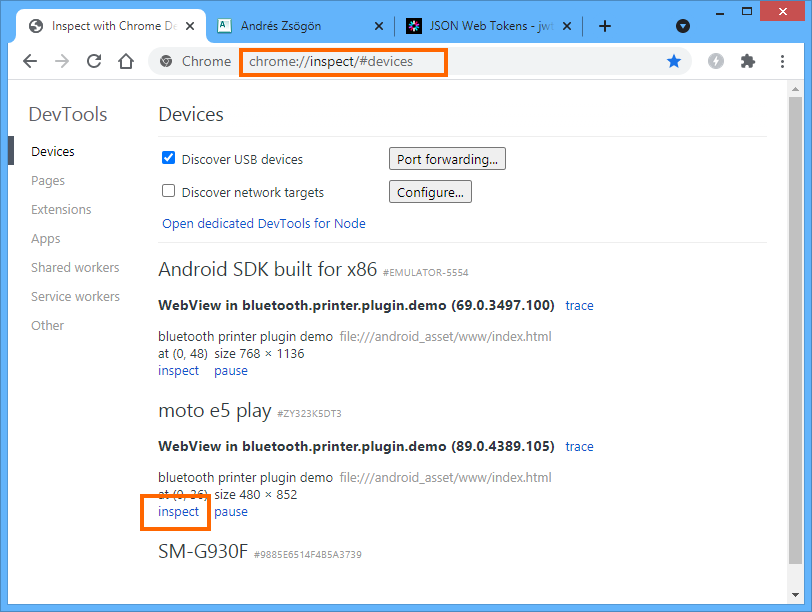
Debug with Chrome Device Inspector
You can debug Android targets from API 19 (4.2.2) and newer using Chrome’s built-in Device inspector tab navigating to chrome://inspect/#devices.
- Your emulators and connected devices with USB debugging enabled will be shown
- Requires at least Android 4.2.2
- Click Inspect to debug a running app
- App must be compiled in debug (unsigned) configuration, you can’t debug signed apps.
Chrome device inspector for Cordova debug
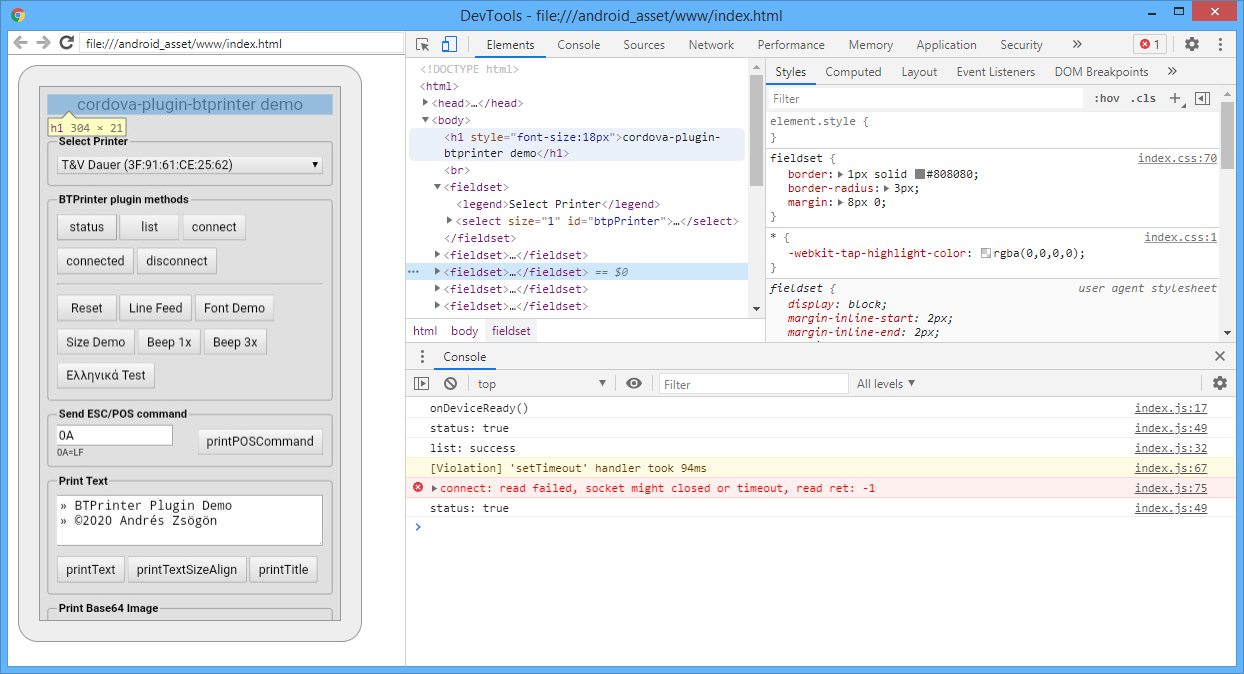
Debug Cordova Android app with Chrome device inspector
This method usually fails or is bugged in older webview implementations. Upgrading your system’s webview or Chrome browser improves reliability.
Selecting the Android Webview implementation to use
With API19+ you can switch the Webview implementation, in case you have problems with Chrome’s webview. Notice you can’t change this from the Developer tools menu, the option to change implementation will be disabled / grayed out.
- To use the Chrome webview, disable the system app Android System Webview.
- To use the Android System Webview, simply disable the Chrome app.
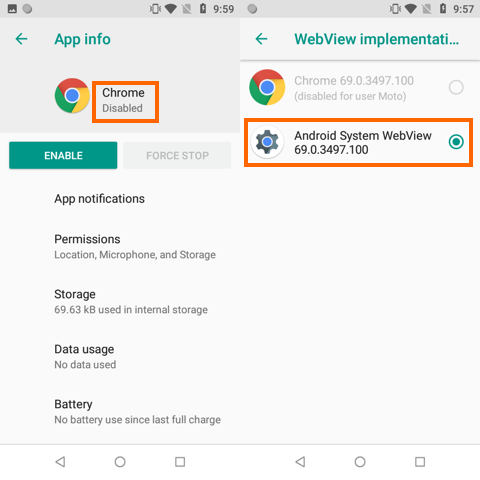
Changing the Webview implementation requires disabling the proper app.
Notice that disabling Chrome will also uninstall its updates and return to it to the same version as the Android System Webview (factory version).
Disclaimer
The content in this post is for general information purposes only. The information is provided by the author and/or external sources and while we endeavour to keep the information up to date and correct, we make no representations or warranties of any kind, express or implied, about the completeness, accuracy, reliability, suitability or availability with respect to the website or the information, products, services, or related graphics contained on the post for any purpose. Some of the content and images used in this post may be copyrighted by their respective owners. The use of such materials is intended to be for educational and informational purposes only, and is not intended to infringe on the copyrights of any individuals or entities. If you believe that any content or images used here violate your copyright, please contact us and we will take appropriate measures to remove or attribute the material in question.